Results & Discussion
Research Results
This section presents the empirical findings from our simulation pipeline, comparing the performance of JKO-simulated defenders against real NBA tracking data.
Metric Validation
To establish the baseline validity of our Instantaneous Shot Threat (IST) metric, we compared the IST values of real NBA defenses against historical field goal success rates and team-level defensive ratings.
As shown in the data, actual NBA Field Goal percentages (FG%) vary significantly across five defined pressure tiers. Shots categorized as “Wide Open” (Tier 1) yielded a 48.46% success rate, while “Smothered” (Tier 5) shots dropped to 42.3%, representing a 12.7% relative decrease in scoring efficiency.
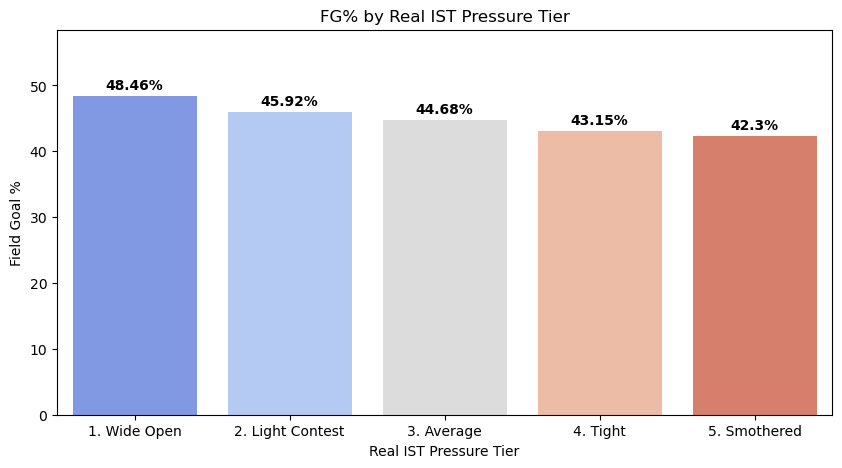
Figure 1: Field Goal Percentage by Real IST Pressure Tier.
At the team level, our analysis illustrates a clear relationship between a team’s Average Real IST per play and their official NBA Defensive Rating. The data indicates a correlation of \(r = 0.307\), demonstrating that topological pressure is a statistically meaningful predictor of defensive efficiency.
Aggregate Threat Reduction
The primary objective of the JKO scheme is to minimize the offensive team’s spatial scoring probability. Per play, real NBA defenders recorded a mean Team IST of 238.73, while the JKO-simulated defenders recorded a mean of 157.33.
This represents a 51.73% reduction in mean threat. Furthermore, the JKO physics engine achieved a global aggregate Frame Win Rate of 97.12%, meaning the simulated defense yielded a lower threat level than real NBA defenders in nearly every micro-movement of the sampled possessions.
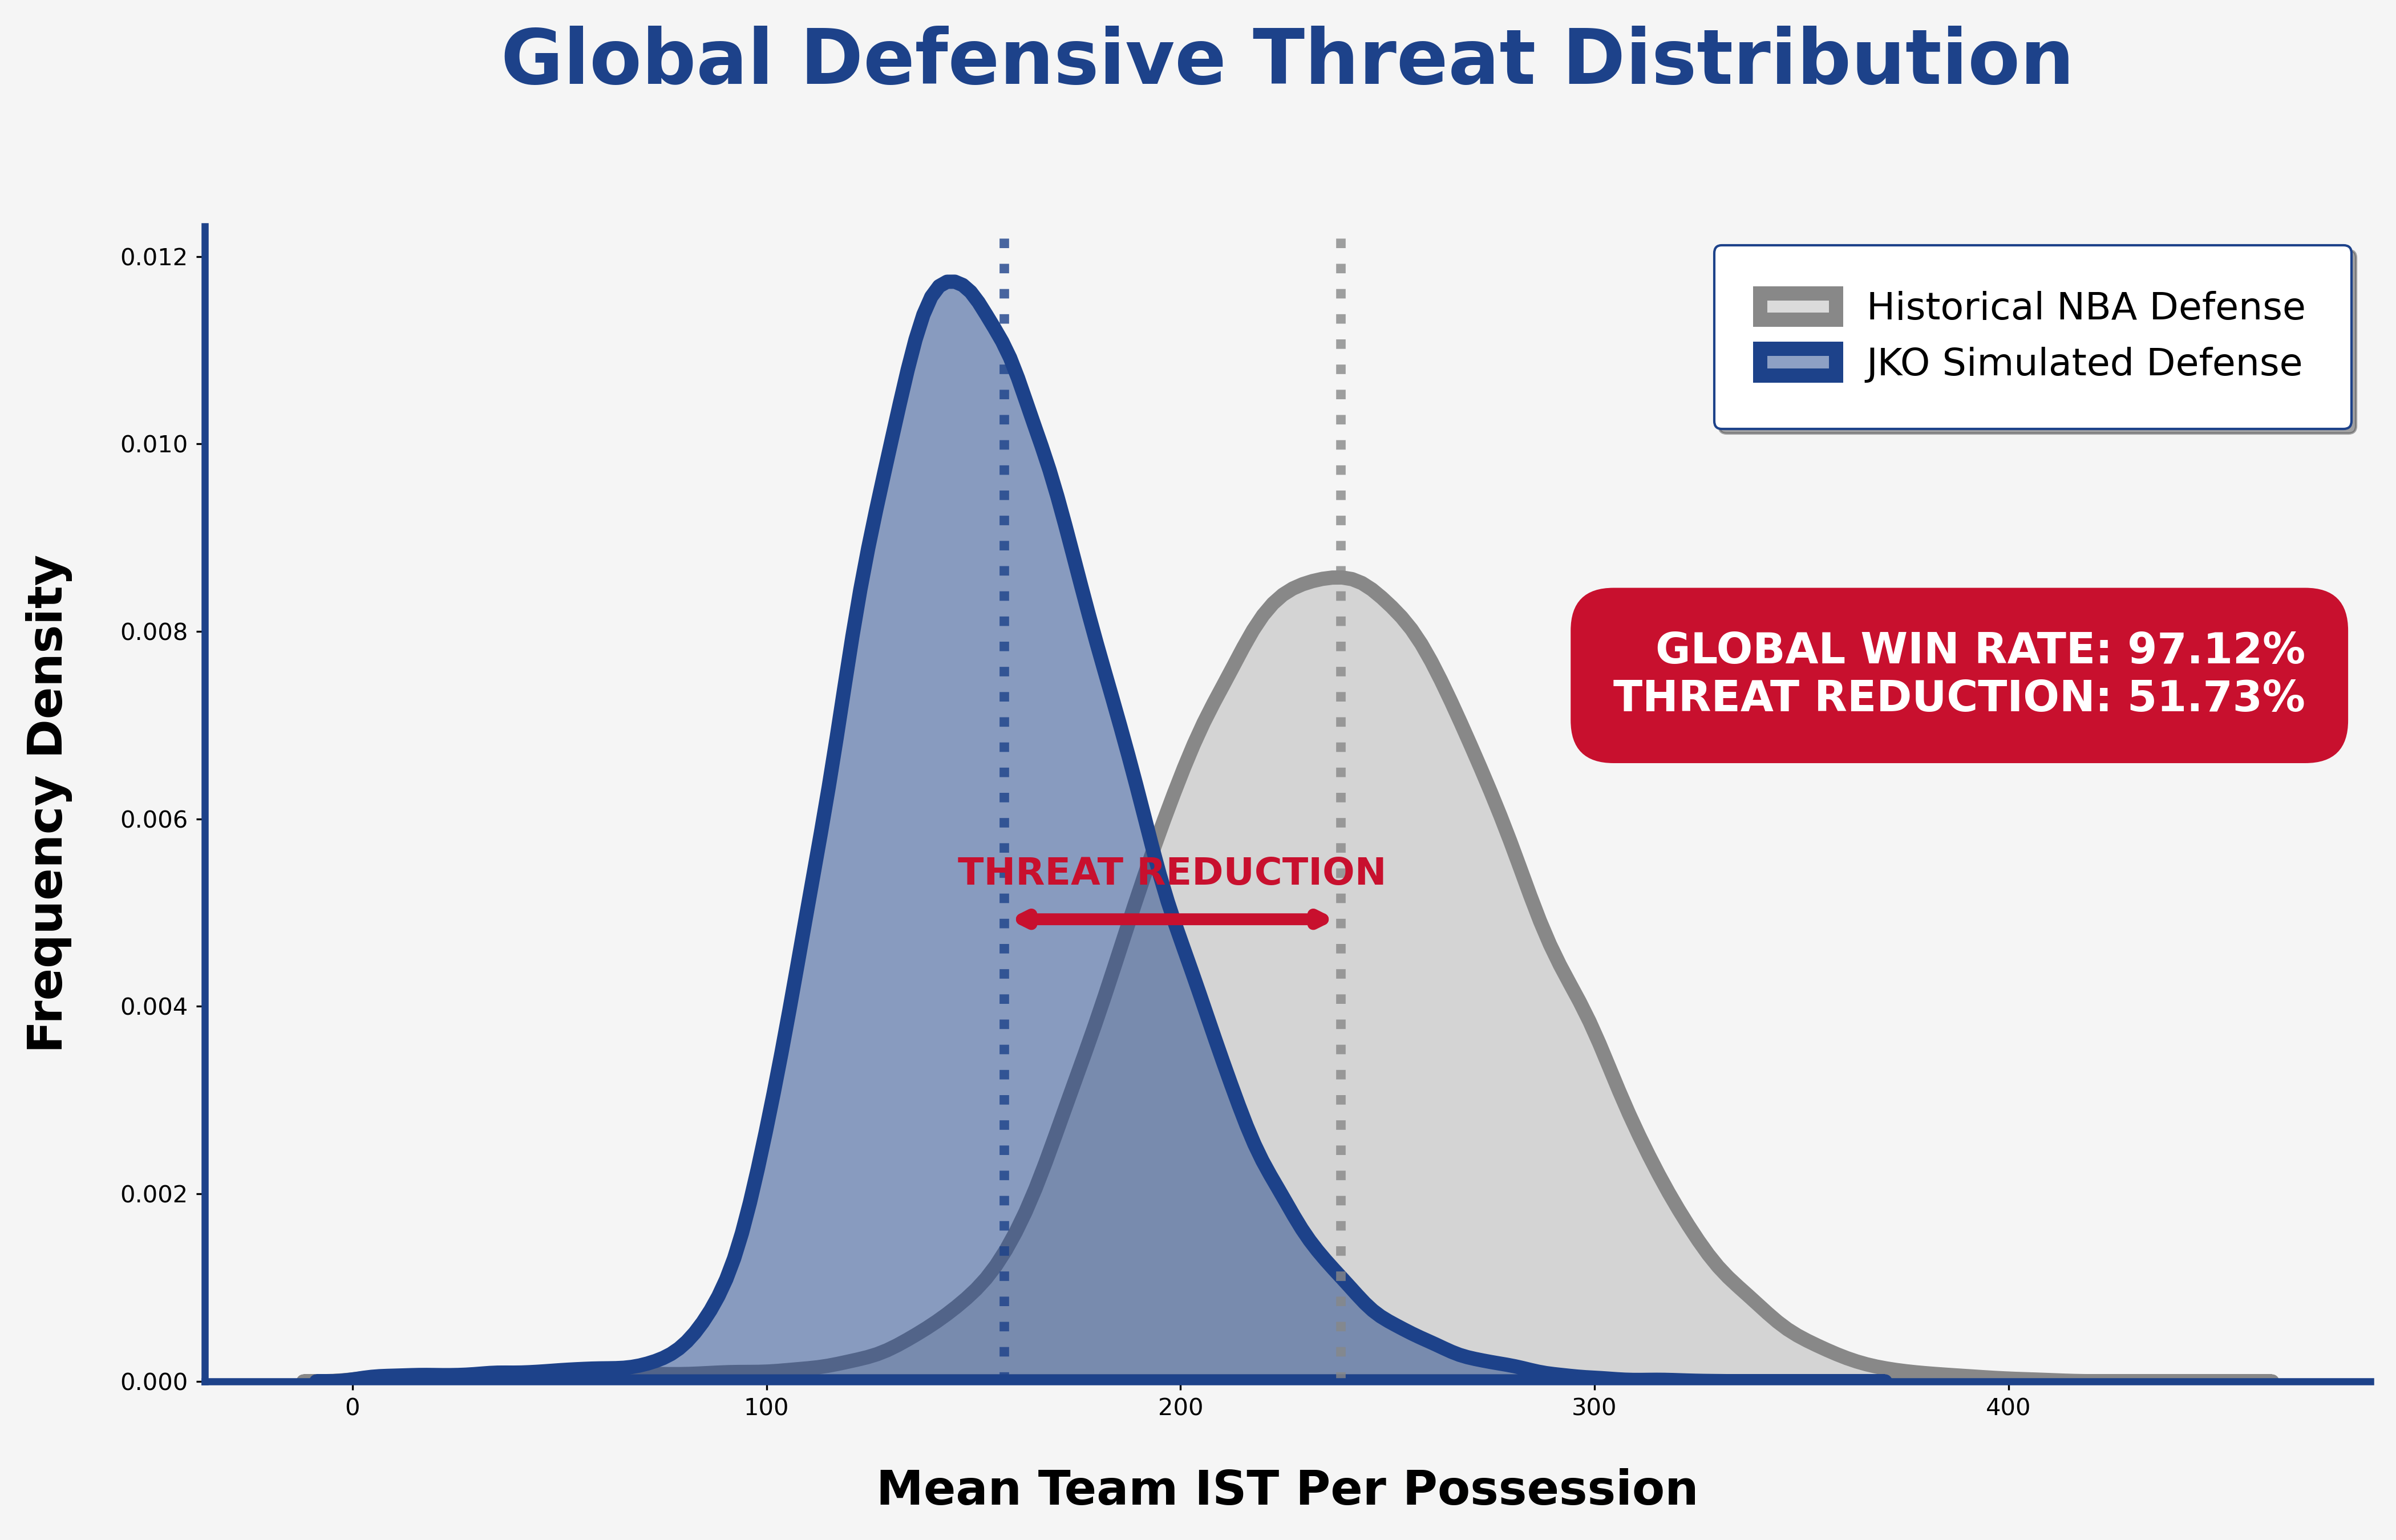
Figure 2: Global Distribution of Team IST showing the significant shift toward lower threat in the simulation.
Defensive Recovery Audit
To evaluate effectiveness in critical breakdowns, we isolated a “high-threat” subset (possessions in the 90th percentile of historical threat). Within this group, the median raw difference between historical and simulated IST was 125.75 units, a 39.39% reduction.
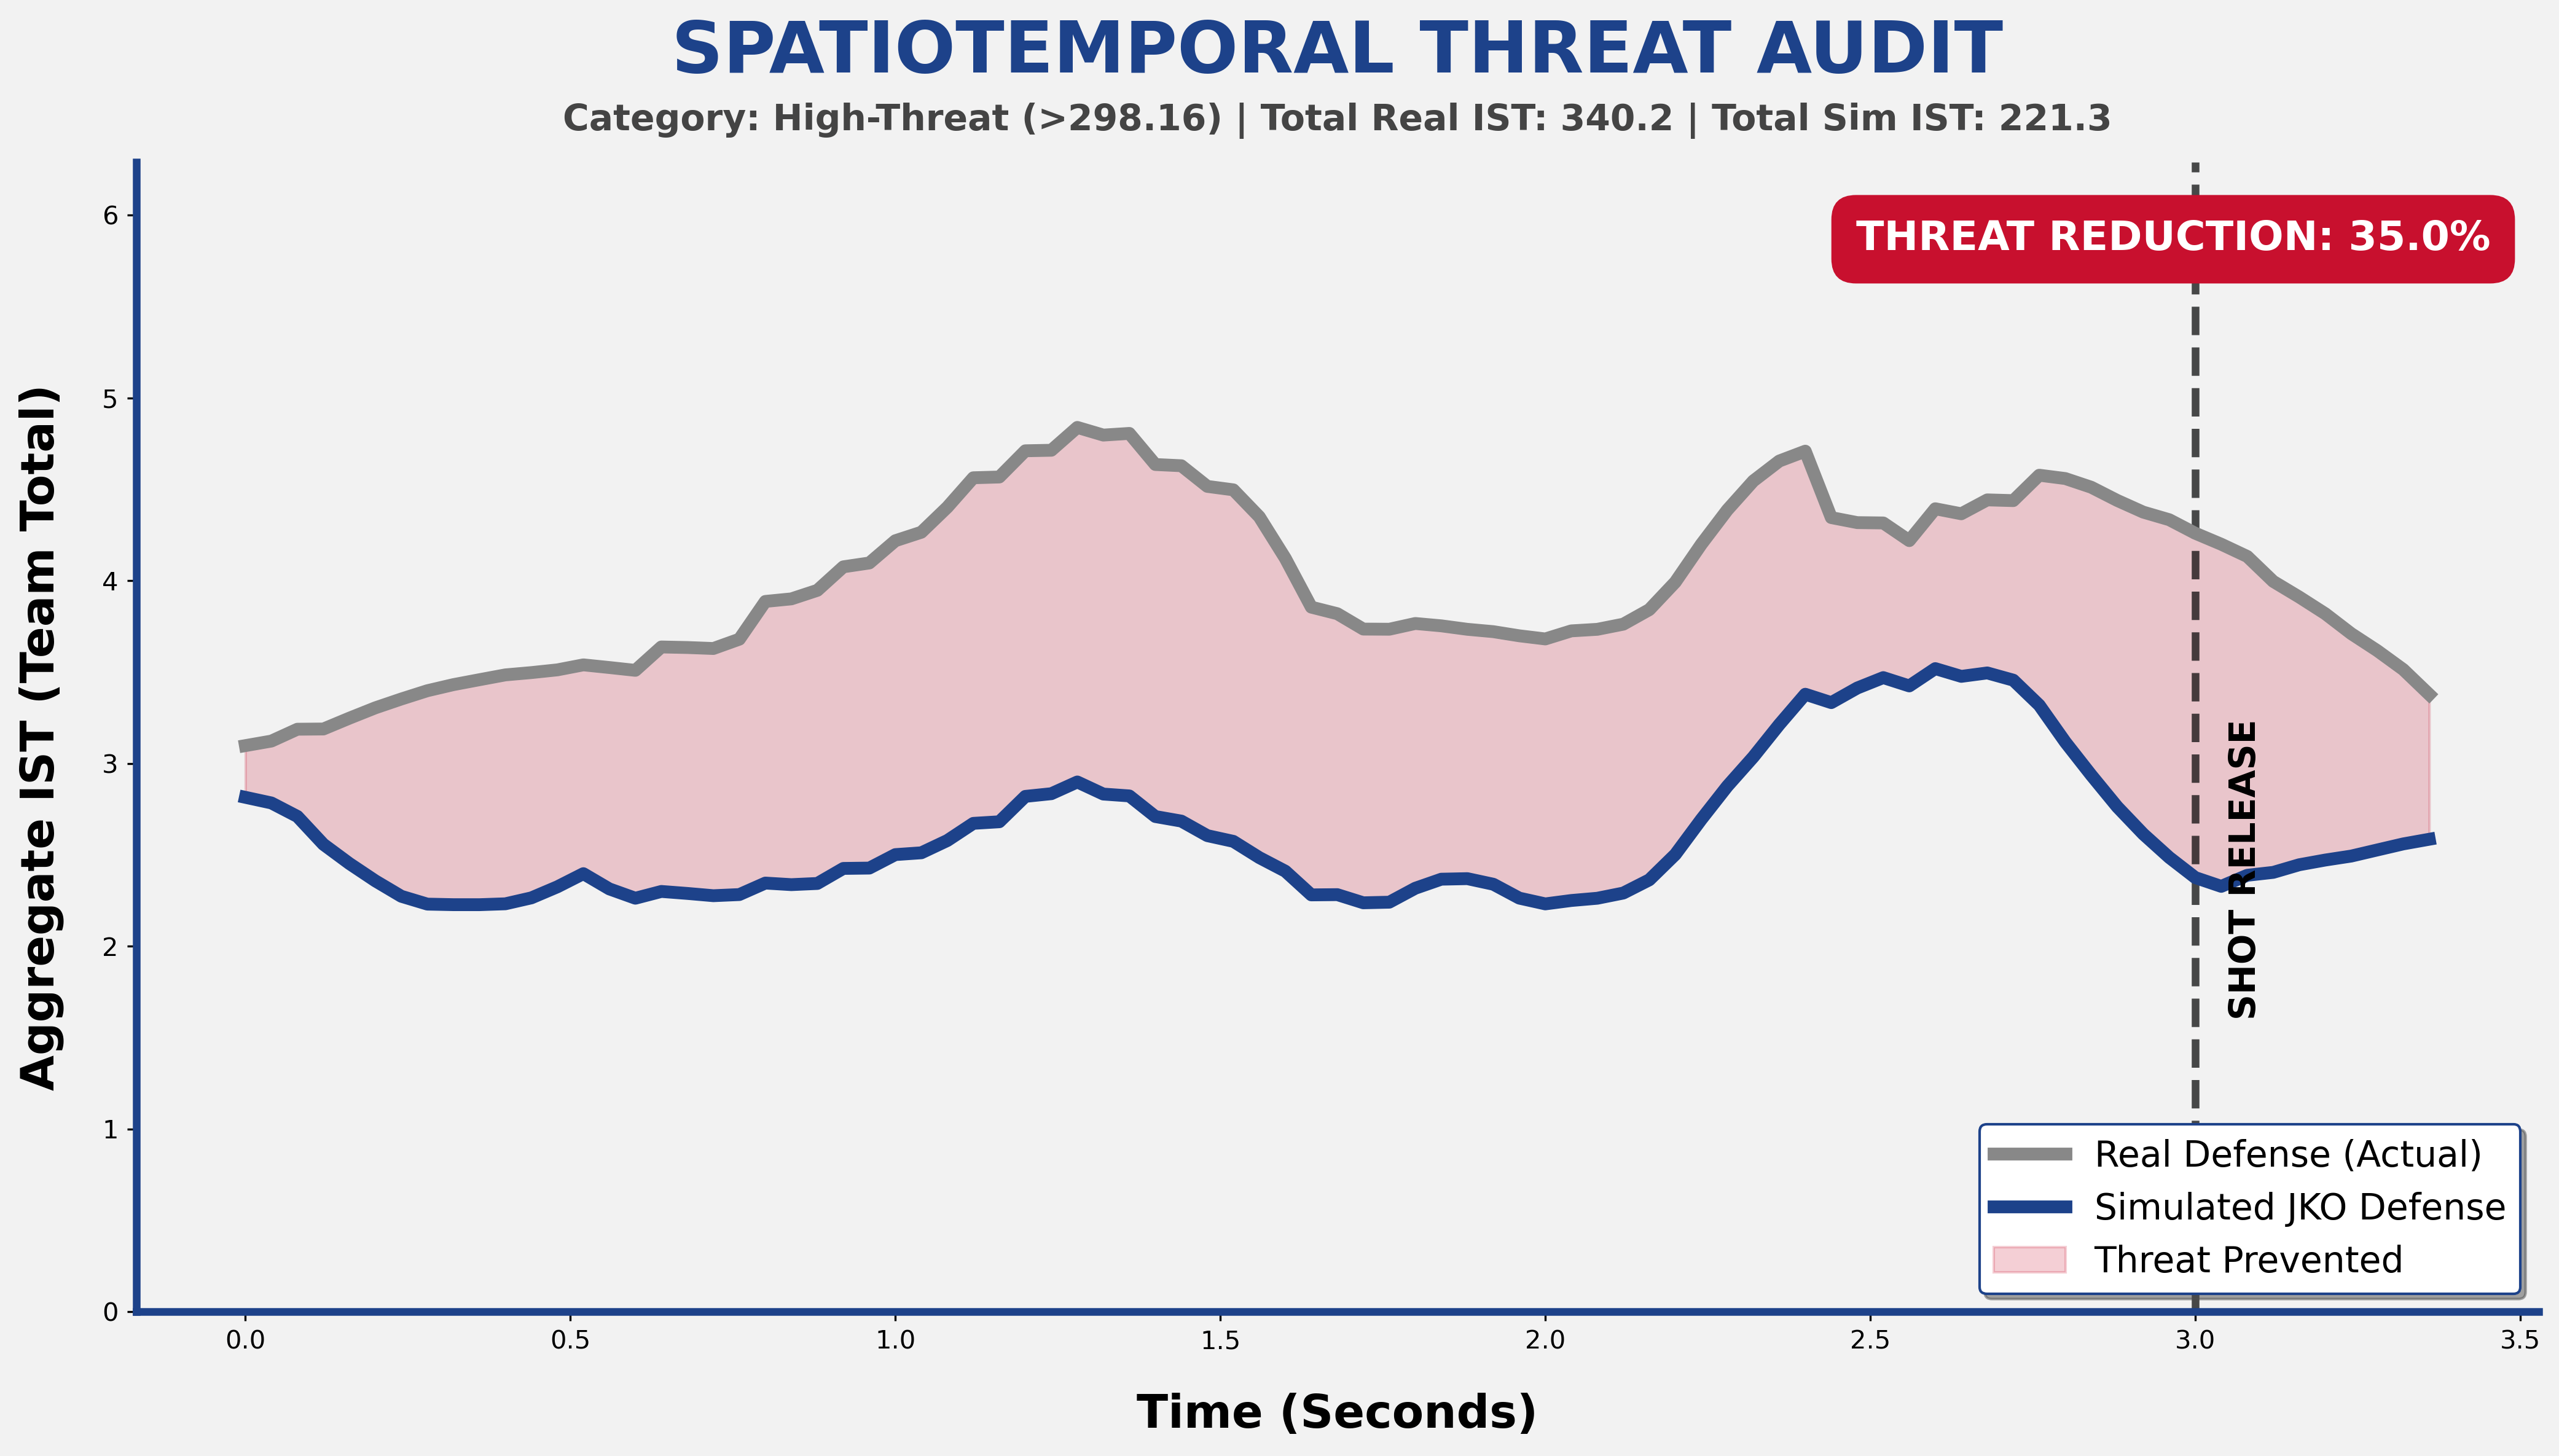
Figure 3: Spatiotemporal audit showing the "Threat Prevented" area over a high-threat possession.
Discussion
By prioritizing mathematical consistency over human intuition, the model provides new insights into optimal defensive positioning and spatial control.
Speed Constraints & Realism
Ideally, simulated defenders should stay within human speed ranges. However, our simulated defenders occasionally surpass soft speed limits due to the steep Gaussian potentials required to “escape” specific gravity wells.
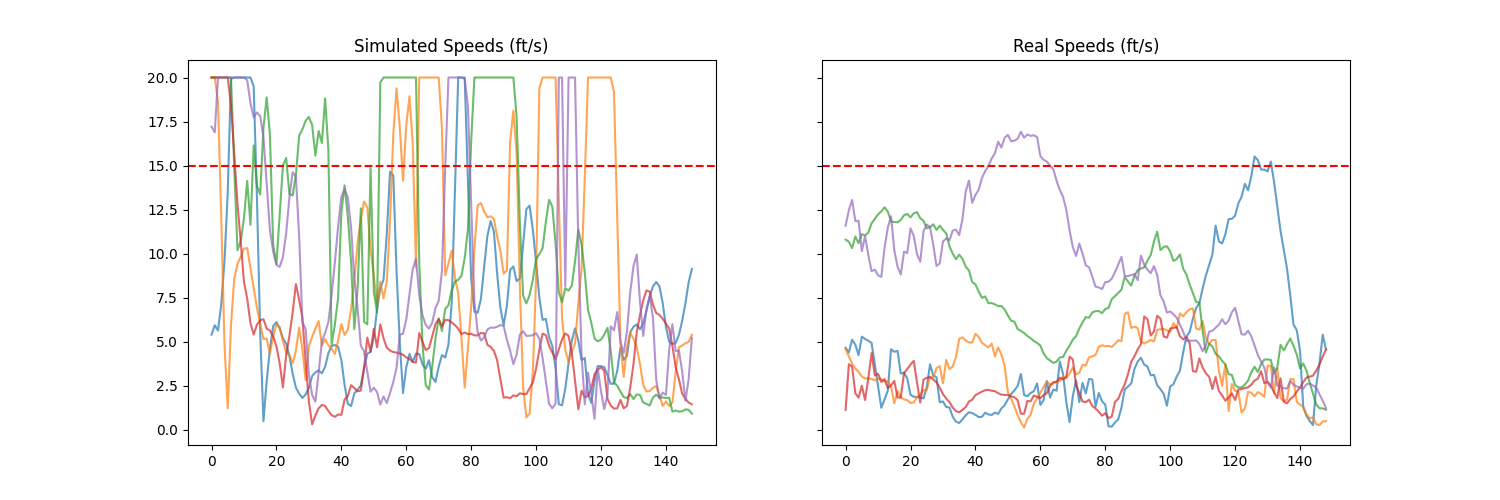
Figure 4: Speed comparison between real human defenders and JKO-simulated agents.
While the speeds are occasionally higher than realistic human movement, the results suggest that gradient-flow solutions are fundamentally safer and more mathematically efficient than traditional defensive heuristics.
Practical Applications
This system allows coaching staffs to instantaneously pinpoint defensive possessions with the highest rate of failure for tactical review. By identifying optimized positions that “go against the grain,” teams can empirically test JKO-driven configurations in controlled practice environments.
Technical Documentation
For a full deep dive into the JKO solver, Sinkhorn divergence, and data audit, view our complete report.
View Technical Report (PDF)